Top 5 Reasons to Use Power BI vs. Excel for Modern Analytics
This article specifically covers the Top 5 reasons to utilize Power BI vs. Excel.
I see a lot of posts on Reddit where people are trying to do stuff in Microsoft Excel that is much better suited to Power BI.
Excel’s been the go-to for data work for decades (first version came out on Apple in 1985!). We all like the familiar. But as data grows and business questions get trickier, a lot of folks start to wonder: should I switch to Power BI?
For starters, Power BI brings stronger tools for handling huge datasets, manipulating data via code, building interactive dashboards, automated refreshes, and sharing insights across teams—definitely more than Excel’s general-purpose approach. Knowing when to pick each tool can save you tons of time and help you make smarter decisions with your data.
Both come from Microsoft and play nicely together, so I don’t want anyone to think this is an either or decision. You should just know which tool to pull out of your tool chest depending on the task. Excel is still my go to for custom 3-statement financial models and cash flow reporting.
This guide breaks down the top five reasons you might reach for Power BI instead of Excel for analytics and business intelligence. I’ll walk you through what makes each unique and toss in some practical advice for picking the right one for your situation.
Key Takeaways
- Power BI can handle bigger datasets and runs faster than Excel for complex analysis.
- It offers more advanced visuals and interactive features for reporting.
- The best choice depends on your data size, how you want to collaborate, and whether you need real-time updates.
The Top 5 Advantages: Power BI vs Excel
Power BI takes the lead in handling massive datasets, building more complex and reusable models with DAX, making interactive visuals, automating refresh and collaboration, and offering enterprise-grade security. These strengths make Power BI the better pick for business analytics and bigger (more repetitive) reporting jobs, while Excel still works well for more ad hoc financial model building and nuanced situations.
Superior Data Handling and Performance
Excel starts to struggle with big datasets. Its row limit sits at about a million rows per worksheet, and things slow down fast once files hit 20–30 MB. Formulas lag, and sharing gets messy when files balloon past 50 MB.
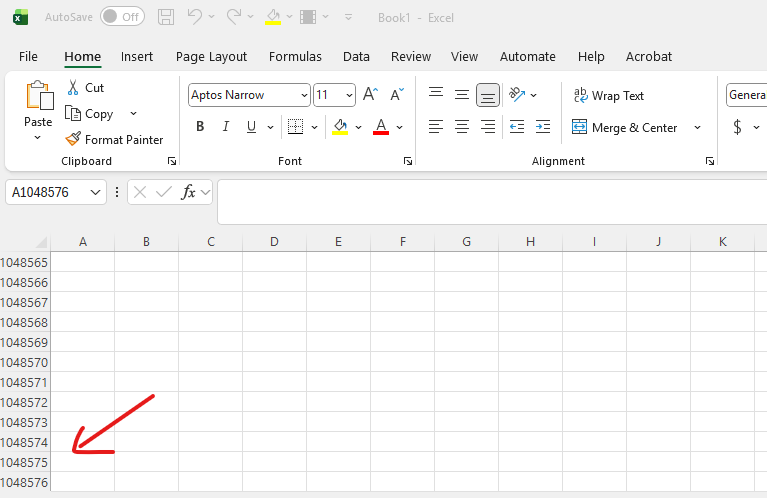
Screenshot of Excel Row Limit
Power BI, on the other hand, can handle millions of rows without breaking a sweat. It uses compression and optimized storage, letting you import 10 million rows in minutes and build dashboards that respond instantly. The in-memory analytics engine in Power BI Desktop processes data way faster than Excel ever could.
You get access to over 160 data sources through Power BI’s built-in connectors. You can also do integrations from other data sources into SQL and simply connect from there. Excel supports maybe 60 or 70, depending on your Office 365 version and really doesn’t work well for directly querying data like in Power BI.
Power Query does data transformation and cleaning in both, but Power BI just plows through much bigger volumes without getting bogged down.
Advanced Data Modeling and Automation with DAX
DAX (Data Analysis Expressions) lets you create metrics you can reuse—no more writing the same formula over and over in different cells. Define a measure once, and you can use it across cards, tables, or charts. Change it in one spot, and it updates everywhere in your report.
Some common DAX measures:
Total Sales = SUM(Orders[Revenue])Profit = [Total Sales] - [Total Cost]Margin % = DIVIDE([Profit], [Total Sales])YOY % = DIVIDE([Total Sales] - [Sales LY], [Sales LY])
DAX understands filter context and data relationships automatically. You can build a star schema with fact and dimension tables, which would take a mess of VLOOKUPs or XLOOKUPs to pull off in Excel. Time intelligence—like year-over-year comparisons—takes just one DAX function, not a stack of nested Excel formulas.
You can create calculated columns, measures, and KPIs that react to slicers and drill-through actions.
Interactive Dashboards and Visualizations
There is a big gap in data visualization capabilities between Power BI. vs. Excel. Power BI gives you fully interactive dashboards. Click a product in one chart, and every other visual updates to show just that product. I love showing this feature to people for the first time and watch their eyes pop out of their head. If you want this in Excel, you’d need VBA or some pretty complicated workarounds.
Key interactive features:
- Cross-filtering—all visuals on a page respond to each other
- Drill-down—move from years to quarters to months, even days
- Dynamic tooltips—hover for details
- Custom visuals—grab what you need from AppSource
Hundreds of custom visuals are available through AppSource, so you can make your dashboard look and work exactly how you want. Excel charts are very basic by comparison. Power BI offers treemaps, KPI cards, decomposition trees, and even real-time streaming visuals. Plus, the mobile apps keep everything interactive on tablets and phones.
These interactive visuals help people make decisions on the spot, instead of waiting for new reports. Power BI is much more of a set it and forget it type setup, so people can return to the same dashboard and self-serve in terms of getting answers for themselves.
Robust Data Refresh, Sharing, and Collaboration
Power BI can refresh your data automatically on a schedule. Direct query is always up to date reading live from the data source whenever you change a slicer. Import utilizes scheduled refresh, which can be at set intervals throughout the day. With Excel, you generally have to open files, refresh connections, and save again.
The Power BI Service gives you cloud-based sharing and collaboration through workspaces, which is amazing for keeping your organizations reporting organized. Additionally, Power BI has row level security, which means the different people can open the same report and see different stuff depending on their areas of responsibility or focus. Pretty incredible stuff!
Collaboration capabilities:
| Feature | Power BI | Excel |
|---|---|---|
| Simultaneous editing | Yes, through workspaces | Limited (Office 365 only) |
| Scheduled refresh | Continuous with Direct Query or 8x daily free with Pro (more with Premium) | No |
| Mobile access | Full functionality via Power BI mobile | Limited |
| Embedding | SharePoint, Teams, Power Apps | File attachments only |
With Power BI Pro, you can share with unlimited viewers. Premium Per User and Premium Capacity unlock features like deployment pipelines and bigger datasets. Users can leave comments directly on visuals and subscribe to reports for automatic delivery. There is a great add-on-called Power BI Robots, which allows you to schedule PDF and excel report delivery to stakeholders. Ultimately, when it comes to data sharing in Power BI vs. Excel, there is a significant advantage to Power BI.
Enterprise-Grade Security and Governance
Row Level Security (RLS) in Power BI restricts what data users see based on their role. Set your rules once in Power BI Desktop, and they’re enforced automatically when people open reports in the Power BI Service. Excel can’t do this—you’d have to make separate files for each user which is an insane time waster.
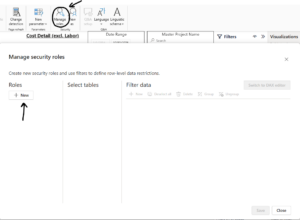
Picture of RLS in Power BI
Your data stays safe with encryption at rest and in transit. Premium Capacity gives you dedicated cloud resources and extra governance options. Workspaces help you organize content and set access levels for different teams.
Power BI Premium bumps up your storage limits and refresh frequency. You can set up real-time analytics with streaming datasets that update dashboards every second. The admin portal gives you usage stats and audit logs for compliance.
Power BI integrates with Office 365 security and conditional access. You control external sharing, export permissions, and sensitivity labels from one place—something Excel just can’t match.
Evaluating When to Choose Power BI or Excel
Each tool has its place in analytics work. Power BI is best for huge datasets and interactive dashboards. Excel is still the top pick for ad-hoc analysis and custom financial models like budgets.
Use Cases Best Suited for Power BI
Go with Power BI when your data blows past Excel’s row limits. It handles millions of rows without slowing or crashing.
Power BI is also your friend if you need to pull together multiple data sources in one report. With over 160 pre-built connectors, you can grab information from databases, cloud services, and the web. It’s ideal for business analytics where you need to merge data from different systems.
Power BI excels at:
- Building interactive dashboards with cross-filtering
- Automating data refresh (daily, hourly, or real-time using direct query)
- Sharing reports with teams through the Power Platform
- Creating reusable metrics with DAX measures
If your organization needs everyone to see up-to-date data without waiting for manual updates, Power BI’s collaboration tools really pay off. Multiple users can view the same live report, instead of passing around static files.
Scenarios Where Excel Still Excels
Excel is still the champ for quick calculations and one-off analysis. For ad-hoc work on smaller datasets, it’s faster to set up and doesn’t need any data modeling.
Detailed financial modeling is also where Excel really shines. You can build complex scenarios, run what-if analysis, and make custom calculations that don’t fit the usual dashboard-based, business intelligence mold. Its cell-based design gives you total control over formulas and layout.
Pick Excel when you need:
- Quick data entry or manual tweaks
- Detailed budget planning with custom formulas
- Pivot tables to explore data fast
- Offline access without needing the cloud
Excel is better for detailed work that needs cell-level precision. If your analysis changes a lot or involves unique calculations, Excel’s formula-first approach is just more flexible than building everything as a DAX measure in Power BI.
Bringing Power BI and Excel Together
As noted above, you really don’t have to pick one or the other —Power BI vs. Excel. Microsoft built them to work side by side, not as rivals.
Start out with Excel for poking around your data and cleaning things up. Once you’ve got a handle on the structure, you can pull it into Power BI for richer visuals and sharing. It is also good to export data from Power BI to Excel to validate and tie things out.
Plenty of teams still rely on Excel for heavy-duty financial modeling or complex calculations, then plug those results into Power BI reports. That way, you get Excel’s number-crunching power and Power BI’s slick visuals and collaboration.
Bottom line, you are not giving up on Excel. You are simply supplementing it with a new tool, Power BI, where the use case makes more sense.